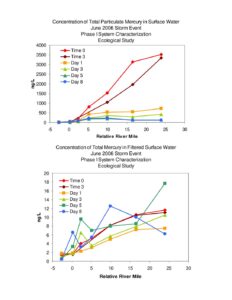
Charts showing concentrations of particulate and filtered total mercury and methylmercury in surface water measured during a June 2006 storm event. Data are presented along relative river mile and multiple sampling times (Time 0, Time 3, Day 1, Day 3, Day 5, Day 8) as part of a Phase I system characterization ecological study.
File Type:
pdf
Categories:
Technical Documents
Publication Date :
2006-06
Type :
Data Report
Review Notes :
PDF contains only graphs titled 'June 2006 Storm Event / Phase I System Characterization / Ecological Study' showing particulate and filtered total mercury and methylmercury over relative river mile and time points. No author, institution, or explicit study location is visible; document type chosen as 'Data Report' based on content. No other metadata was present in the pages provided.