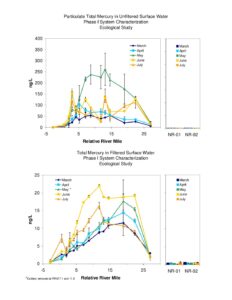
Figures from a Phase I ecological study showing surface-water monitoring results for the South River. Charts present particulate and filtered total mercury and methylmercury concentrations by relative river mile for monthly sampling (March–July), plus percent methylation metrics. Notes indicate outliers removed at RRM 7.1 and 11.8.
File Type:
pdf
Categories:
Technical Documents
Publication Date :
Type :
Monitoring Report
Review Notes :
No publication or sample year is visible in the PDF; the file appears to be a set of figures/pages from a monitoring study rather than a full report. Existing WordPress metadata was not used to infer a date.