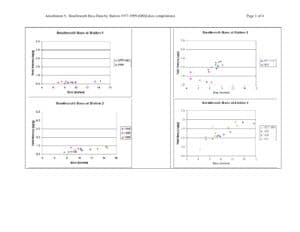
This four-page PDF (Attachment 5 of a DEQ data compilation) presents scatter plots of total mercury (µg/g) versus fish length for smallmouth bass collected at multiple stations in the South River watershed. Data span 1977–1999 and display station-specific mercury concentrations for stations 1, 2, 5, 6, 9, 10, 13, and 14 across several sampling years.
File Type:
pdf
Categories:
Technical Documents
Publication Date :
1905-06-21
Type :
Data Report
Review Notes :
PDF is labeled 'Attachment 5' of a DEQ data compilation covering 1977–1999 and contains scatter plots of total mercury (µg/g) versus fish size for specified stations. No author or formal publication date is visible; document_date set to 1999 based on the compilation end year shown in the header.